Congratulations, you just found 4 gold nuggets with our screener and you want to invest your 1000$. You connect to your favorite broker, search for the first company, click on invest and … you’re stuck. How much should I invest in this company? Well, the most obvious answer is to split your 1000$ equally and invest 250$ for each company. But it does not feel good because one of the companies seems more risky and 2 companies are in the same market. Welcome to the science of portfolio management, the purpose of this article is to give you insight into how to weight assets in your portfolio. No rocket science here, just a basic example to understand the concept.
For the sake of understanding, the mathematical explanation has been skipped! You’re welcome !
Concept of Risk, Return and Covariance :
The simple scenario : Risk and Return for an asset
To start with basic notion, each asset have 2 properties :
- An inherent risk, directly related to volatility
- An expected return or the money you can expect by investing in this company.
As you have probably heard many times, high risk means high return. But that doesn’t really help you. How to put a number on risk and return?
When everything is connected: risk and return for multiple assets
Example of Correlated Portfolio with Multiple Assets
The calculation becomes more complicated when you start investing in multiple assets. To understand the problem, let’s take 2 investors.
- Investor 1 believes strongly in the auto industry, so he’s willing to invest in both Ford Motors and BMW.
- Investor 2 has two passions, cars and coffee (why not?), and is willing to invest in both BMW and Starbuck’s.
For the sake of simplicity, let’s assume that the 3 companies have the same risk and the same return.
| Risk | Annualised Return | |
| Ford Motors | 20% | 10% |
| BMW | 20% | 10% |
| Starbuck | 20% | 10% |
So both investors decide to invest 50% of their equity in the 2 companies they have chosen. On paper, it appears that Investor 1 and Investor 2 took the same risk, since all assets have the same risk ratio of 20%.
But, and there is always a but, you tend to forget that things are correlated. Imagine for a second that a new company creates the cheapest, most environmentally friendly car and destroys the car industry. So all the other car manufacturers in the world will go bankrupt, the stock price will crash, and the old car companies will be worth nothing.
In this extreme case, Investor 1, who invested all his money in the car industry, will lose everything. Investor 2 will lose half his money.
Basic notions of Covariance for Portfolio Asset
Now you see the point, there is something more when you consider a portfolio with multiple assets. You have to consider the correlation between the stocks. Correlation can be described as the tendency for stock prices to move in the same direction and at the same time. Two companies are correlated when they have a lot in common (same market, same country, etc..). Two companies are less correlated when they have few things in common (for example, Starbuck and BMW).
In practice, we talk about covariance and it’s a number between -1 and 1:
- Covariance greater than 0: The assets are correlated and move in the same direction.
- For example, Ford Motors and BMW share the same market.
- Covariance close to 0 : Assets have little in common
- For example, Starbuck and BMW
- Covariance less than 0: The assets are 100% correlated, but in opposite directions.
- For example, if the technology of company 1 has a negative impact on company 2 (printer company VS a pen company)
Based on this (and also based on Modern Portfolio Theory), we are able to calculate the risk of each portfolio.
The Big Theory of Portfolio Management
In the fabulous world of mathematics, if there is a formula, there is a solution. The problem of weighting multiple assets within the same portfolio is definitely a mathematical problem, so good for you, it seems you may have an answer.
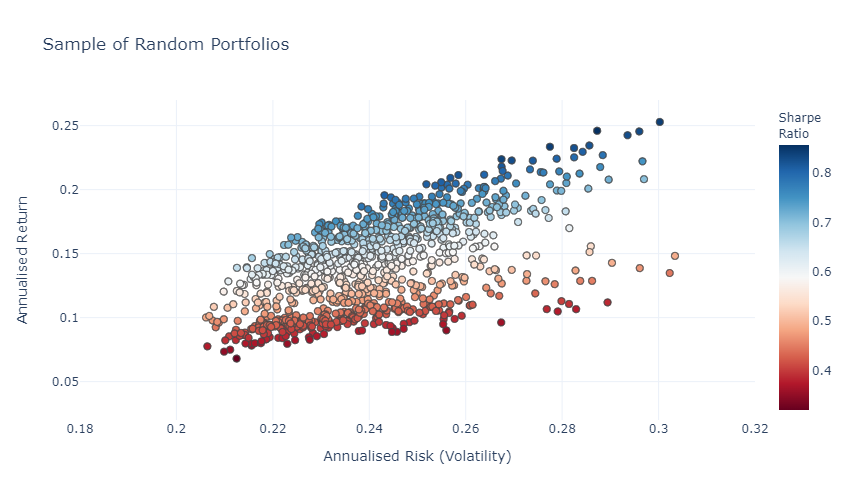
Take a portfolio with 5 assets and create 10,000 random allocations for this portfolio to plot the annualized return VS the annualized risk and you get the following:

This chart shows thousands of portfolios based on just 5 assets. We can see for different allocation we have different risk and different return. One valuable information is for the same annualized return there are several portfolio with lower and higher risk.
In other words, the graph shows that higher risk gives higher return, but we could have the same return with less risk! The same if we consider a fixed return, there is always a less risky way to get that return.
Below is a portfolio with 11% return for 20% risk and another portfolio with 11% return for 29% risk.

The Efficient Frontier
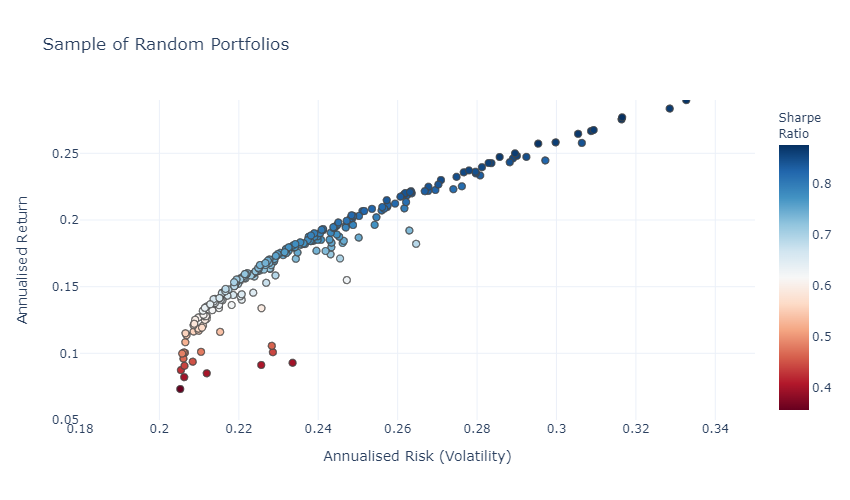
Remember, the plot comes from 5 assets that we randomly weighted. It seems that there is a curve, let’s push the simulation and plot only the best risk/return ratios.

That’s it, we have something to work with! There is a frontier (called Efficient Frontier) where we can find the best portfolio we can compose with our 5 assets. The solution to your problem is here! Based on the expected return you want, you can create the most efficient portfolio.
If you’re 5 stocks were AMGN, WMT, TGT, MSFT and AAPL, to have an expected return of 15% with the minimum risk, you need to weight each asset as follows.
| AMGN – Amgen | 23% |
| WMT – Wallmart | 34% |
| TGT – Target | 7% |
| MSFT – Microsoft | 10% |
| AAPL – Apple Inc | 27% |
The solution seems obvious: Amgen is a medical company and is more volatile. At the same time, Wallmart and Target (two retail companies) are correlated. Same with Microsoft and Apple in technology companies. So to avoid risk, we diversify and we don’t exceed 40% in a same sector and we avoid to have too much in a risky company like Amgen.

Conclusion :
I hear you, it was a nice introduction to the concept of portfolio management. But you still don’t have an answer to your problem. You’re still guessing how much money to put into each of your chosen investments. Do not worry! Portfolio management and calculations require a great understanding of mathematical concepts (such as statistics and optimization). Our purpose was to introduce the concept, but we developed the tool within our platform. Have a look at our advanced portfolio tool to start optimizing your investment.

Pingback: Stock Market - Creating a better CAC40 index (+300%) - How To?