
We often hear that it is hard to beat the market, but what is the market ? Should we consider S&P500 as the better performance we can achieve in stock investment. But if we look at an index for what it is, a portfolio of different companies, could we apply the portfolio management theory? In this article, let’s try to recreate a better CAC40 (French index) where we use the Efficient Frontier to ponderate differently the CAC40.
What is an Index like CAC40 ?
CAC40, SP500, DAX30 are what we call an index. They are often linked to a country as a representation of the economic performance of a country. But in reality, the definition is simple (even if the interpretation could be more complex). The only thing we need to know is that an index (such as CAC40) represents a portfolio of 40 companies from France. If you buy 1 share of the CAC40, you invest in 40 different companies with different weights.
We choose the CAC40 instead of the SP500 because only 40 different stocks make up the index. First of all, we need to extract the historical price for each asset. The longer the better, but we can only go back 3500 days in the past.
We’ll start at day 0 and create the table for the daily return (%):
| Day | AI | AIR | ALO | … |
| 0 | -1.8% | 0.57% | -0.4% | … |
| 1 | 1.3% | 0.21% | 1.07% | … |
| 2 | 2% | 0.23% | 1.11% | … |
Once the daily return is calculated for day 0 through day 1750, we use half of the data to find a optimisation and the rest to test our model.
Search for correlated companies within CAC40
Based on the daily return, we can create a covariance matrix that represents the correlation between two assets. The purpose is easy to understand. When you look at a portfolio, in order to avoid risk, we try to balance the portfolio. So it’s important to know which assets are highly correlated because they may represent the same risk.
For example, if we take the asset BNP (BNP Paribas – Bank), it shows a high correlation with 2 other assets GLE (Société Général – Bank) and ACA (Crédit Agricole – Bank).
Minimize our Risk/Benefits Ratio
Imagine for a moment that our index is made up of 4 companies: 3 banks and 1 car manufacturer. The first calculation shows that
- The 3 banks are highly correlated (volatility and direction).
- The car manufacturer is not correlated with the bank.
- All 4 companies as a daily return of 1%.
Without taking into account the “risk”, we can buy all the companies with equal weights (25% for each bank, 25% for the car manufacturer) for an expected daily return of 1%. But if there’s a banking crisis, 75% of our portfolio will be affected. So maybe a better allocation is
- 50% of the car manufacturer
- 50% in the 3 banks
Simulation of multiple portfolios :
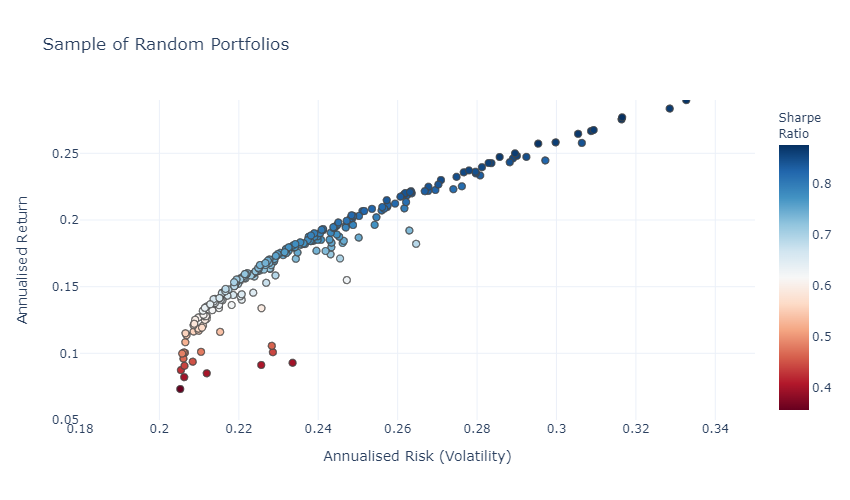
The mathematical expression is well known, we need to minimize the weighted sum of risk times daily return. The risk is represented by the calculated covariance (related to volatility) and the weights are the variables we want to optimize.
To perform such an optimization, we simulate 100,000 random portfolios and keep only the best risk/return. We can see that there is a frontier (called the efficient frontier) that represents the best portfolio for a given risk (or for a given return):
Now you see my point, if we look at the correlation between companies, we have a better understanding of the global risk. Back to the CAC40, let’s start calculating the correlation. And save the best portfolio for the period from day 0 to day 1750.
With the 2 best portfolios, we’ll compare them with the CAC40 between day 1750 and day 3000.
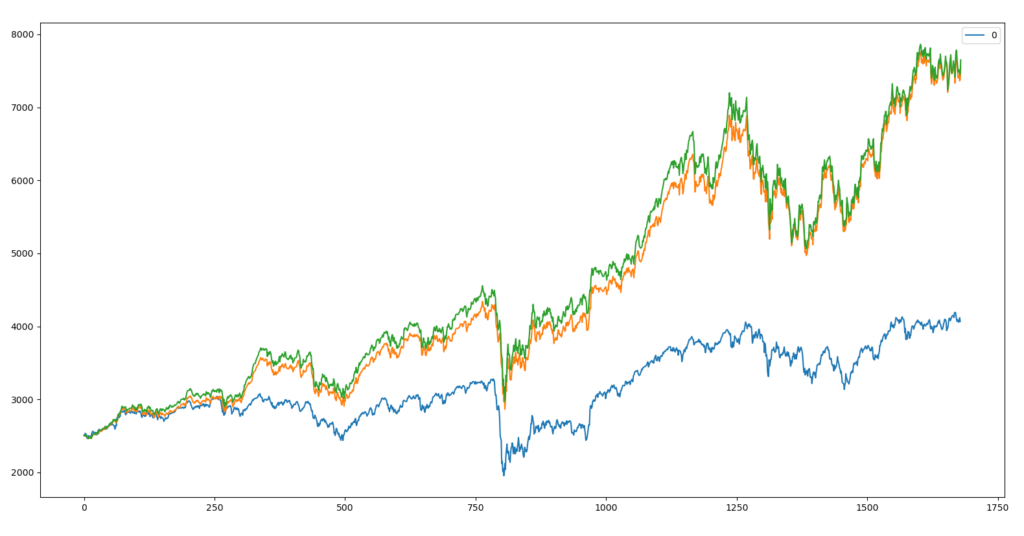
For the period from day 600 to day 1200, we have the following results :
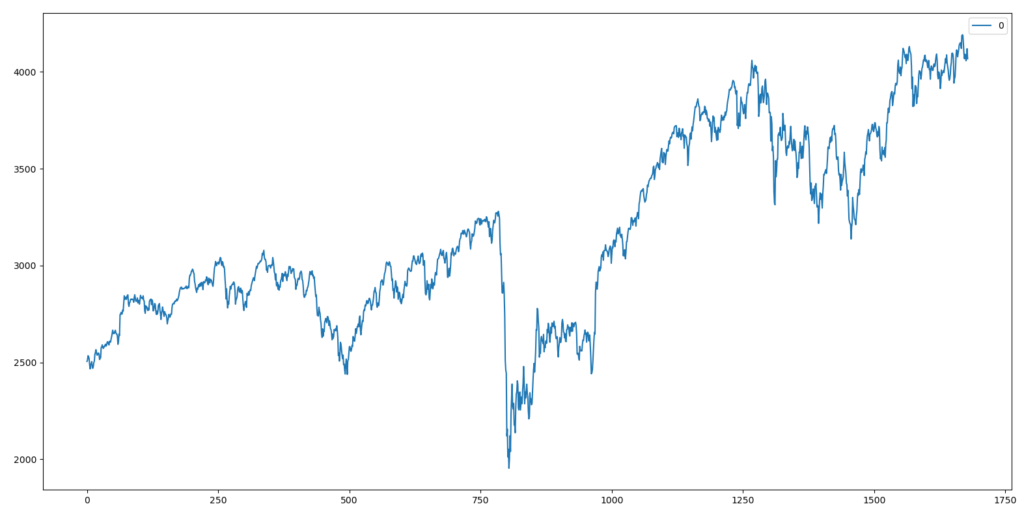
| INDEX | Initial Price | Final Price | Return after 600 days |
| CAC40 | 2500€ | 4070€ | 62.8% |
| Better CAC40 n°1 | 2500€ | 7647€ | 205.9% |
| Better CAC40 n°2 | 2500€ | 7553€ | 202.1% |
Conclusion :
There are 3 conclusions we can draw from this article. The first one is that we are able to create a better CAC40 by rebalancing the weight for each asset. We tend to leverage high risk but high return assets. But the purpose was to maximize the return. But is it worth it? Well, not really for individual investors. We’re going to drown in fees. In the case of a portfolio of 5 – 10 stocks, this method is really useful and can be found in our platform.
The second conclusion is more about the limits of the theory, we use past daily returns to predict future daily returns. It’s a big hypothesis that could generate debate.
Finally, portfolio optimization is limited when the number of assets is large. With a high number of assets, we have a natural diversification.
Annexe 1 : Weight of the Better CAC40 n°1
Share Code AI – Weight 0.52 %
Share Code AIR – Weight 0.03 %
Share Code ALO – Weight 1.53 %
Share Code MT – Weight 1.67 %
Share Code CS – Weight 0.01 %
Share Code BNP – Weight 0.81 %
Share Code EN – Weight 3.4 %
Share Code CAP – Weight 2.99 %
Share Code CA – Weight 1.72 %
Share Code ACA – Weight 5.33 %
Share Code BN – Weight 2.4 %
Share Code DSY – Weight 0.64 %
Share Code EDEN – Weight 3.41 %
Share Code ENGI – Weight 4.35 %
Share Code EL – Weight 0.94 %
Share Code ERF – Weight 5.02 %
Share Code RMS – Weight 4.87 %
Share Code KER – Weight 4.81 %
Share Code LR – Weight 0.64 %
Share Code OR – Weight 2.99 %
Share Code MC – Weight 3.22 %
Share Code ML – Weight 2.52 %
Share Code ORA – Weight 5.26 %
Share Code RI – Weight 0.45 %
Share Code PUB – Weight 0.91 %
Share Code RNO – Weight 0.98 %
Share Code SAF – Weight 4.32 %
Share Code SGO – Weight 3.37 %
Share Code SAN – Weight 4.75 %
Share Code SU – Weight 2.39 %
Share Code GLE – Weight 2.15 %
Share Code STMPA – Weight 4.18 %
Share Code TEP – Weight 0.9 %
Share Code HO – Weight 2.29 %
Share Code TTE – Weight 5.27 %
Share Code URW – Weight 2.01 %
Share Code VIE – Weight 3.51 %
Share Code DG – Weight 3.42 %
Annexe 2 : List of tickers in CAC40
- AIR LIQUIDE – AI
- AIRBUS GROUP – AIR
- ALSTOM – ALO
- ARCELORMITTAL – MT
- AXA – CS
- BNP PARIBAS – BNP
- BOUYGUES – EN
- CAPGEMINI – CAP
- CARREFOUR – CA
- CREDIT AGRICOLE – ACA
- DANONE – BN
- DASSAULT SYSTEMES – DSY
- EDENRED – EDEN
- ENGIE – ENGI
- ESSILORLUXOTTICA – EL
- EUROFINS SCIENTIFIC – ERF
- HERMES INTERNATIONAL – RMS
- KERING – KER
- LEGRAND – LR
- L’OREAL – OR
- LVMH – MC
- MICHELIN – ML
- ORANGE – ORA
- PERNOD RICARD – RI
- PUBLICIS – PUB
- RENAULT – RNO
- SAFRAN – SAF
- SAINT-GOBAIN – SGO
- SANOFI – SAN
- SCHNEIDER ELECTRIC – SU
- SOCIETE GENERALE – GLE
- STELLANTIS – STLAP
- STMICROELECTRONICS – STMPA
- TELEPERFORMANCE – TEP
- THALES – HO
- TOTALENERGIES – TTE
- UNIBAIL-RODAMCO-WESTFIELD – URW
- VEOLIA ENVIRONNEMENT – VIE
- VINCI – DG
- WORLDLINE – WLN