
Introduction
When a stock tops and starts to decline, there are certain factors to look for. These factors do not necessarily involve changes in a stock’s fundamentals. Many institutional investors tend to sell before any trouble shows up in the company’s financial statements. If the smart money is selling, individual investors should follow suit. While fundamentals like earnings and sales are important, stocks often peak when earnings are strong and projected to continue growing.
To recognize when a stock may be topping, there are several signals to watch for. These signals can include price movements, such as climax tops, as well as adverse volume and other signs of weak action. It may take time and practice to fully understand and apply these signals in your decision-making process. These rules and principles have been effective in guiding our decisions in the market.
Many successful investors have found success by applying three or four of these rules. It is unlikely that you will grasp everything in one reading, so continued study and application are necessary.
Two Things to Remember about Selling
In selling, there are two important things to remember.
Firstly, buying the right stocks at the right time is crucial. By purchasing stocks at the correct price and not chasing or pyramid buying when the price is too high, you can avoid most selling problems. Winning stocks usually don’t drop more than 8% below the pivot point, so buying close to this point is essential for minimizing losses.
Secondly, be cautious of big-block selling after you have bought a stock during a bullish market. This selling could be emotional, uninformed, temporary, or not as large as it appears. The best stocks can experience sharp sell-offs for a few days or a week, but it is important to consult a weekly stock chart for perspective and not be scared off by normal pullbacks. Winning stocks may sometimes pull back to their buy point or slightly below, but should not drop 8% unless you initially bought them too high. Avoid buying stocks significantly above the correct buy point to prevent mistakes.
Climax Tops
Leading stocks often experience explosive upward moves known as climax runs.
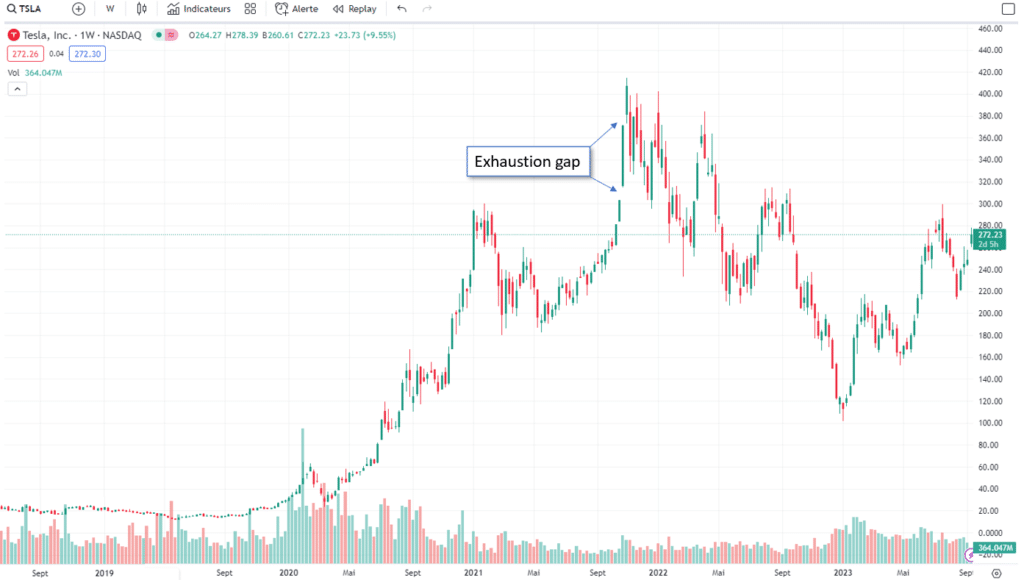
These runs occur when the stock rapidly accelerates in price for a short period, typically one to two weeks, following a prolonged advance. Another characteristic of these stocks is their tendency to end with exhaustion gaps. These gaps happen when the stock opens at a higher price than the previous day’s close, accompanied by significant trading volume. The details and implications of these climax signals, as well as other related indicators of bull market tops, are extensively discussed in this context. Understanding these patterns and signals can assist investors in recognizing potential turning points and making informed decisions regarding their holdings.
1. Largest daily price run-up. If a stock’s price is extended (that is, if it’s had a significant run-up for many months from its buy point off a sound and proper base) and it closes for the day with a larger price increase than on any previous up day since the beginning of the whole move up, watch out! This usually occurs very close to a stock’s peak.
2. Heaviest daily volume. The ultimate top might occur on the heaviest volume day since the beginning of the advance.
3. Exhaustion gap. If a stock that’s been advancing rapidly is greatly extended from its original base many months ago (usually at least 18 weeks out of a first- or second-stage base and 12 weeks or more if it’s out of a later-stage base) and then opens on a gap up in price from the previous days close, the advance is near its peak. For example, a two-point gap in a stock’s price after a long run-up would occur if it closed at its high of $50 for the day, then opened the next morning at $52 and held above $52 during the day. This is called an exhaustion gap.
4. Signs of distribution. After a long advance, heavy daily volume without further upside price progress signals distribution. Sell your stock before unsuspecting buyers are overwhelmed. Also know when say investors are due to have a long-term capital gain.
5. Stock splits. Sell if a stock runs up 25% to 50% for one or two weeks on a stock split. Stock tend to top around excessive stock split
6. Increase in consecutive down days For most stocks, the number of consecutive down days in price relative to up days in price wiIl probably increase when the stock starts down from is top. You may see 4 or 5 days down, followed by 2or 3days up.
8. Upper channel line. You should sell if a stock goes through its upper channel line after a huge run-up. (On a stock chart, channel lines are somewhat parallel lines drawn by connecting the lows of the price pattern with one straight line, and then connecting 3 high points made over the past four to five months with another straight line) Studies show that stocks that surge above their properly drawn upper channel lines should be sold.
9. 200-day moving average line. Some stocks may be sold when they are 70% to 100% or more above their 200-day moving average price line.
Low Volume and Other Weak Action
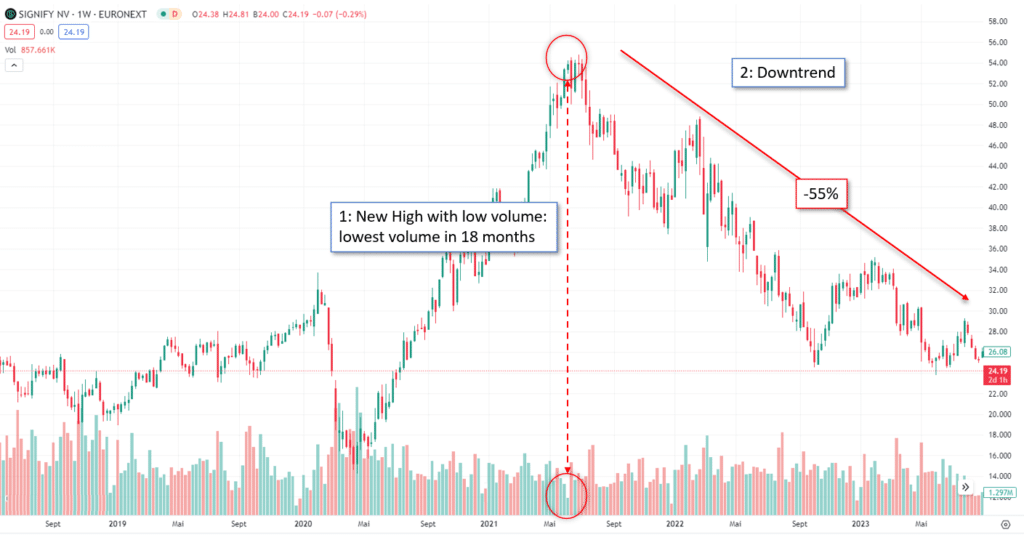
1. New highs on low volume. Some stocks will make new highs on lower or poor volume. As the stock goes higher, volume trends lower, suggesting that big investors have lost their appetite for the stock.
2. Closing at or near the day’s price low. Tops can also be seen on a stock’s daily chart in the form of “arrows” pointing down. That is, for several days, the stock will close at or near the low of the daily price range, fully retracing the day’s advance.
3. Third- or fourth-stage bases. Sell when your stock makes a new high in price off a third- or fourth-stage base. The third time is seldom a charm in the market. By then, an advancing stock has become too obvious, and almost everyone sees it. These late-stage base patterns are often faulty, appearing wider and looser. As much as 80% of fourth-stage bases should fail, but you have to be right in determining that this is a fourth-stage base.
Breaking Support
Breaking support occurs when stocks close for the week below established major trend lines.
1. Long-term uptrend line is broken. Sell if a stock closes at the end of the week below a major long-term uptrend line or breaks a key price support area on overwhelming volume. An uptrend line should connect at least three intraday or intraweek price lows occurring over a number of months. Trend lines drawn over too short a time period aren’t valid.
2. Greatest one-day price drop. If a stock has already made an extended advance and suddenly makes its greatest one-day price drop since the beginning of the move, consider selling.
3. Falling price on heavy weekly volume. Sell if a stock breaks down on the largest weekly volume in its prior several years.
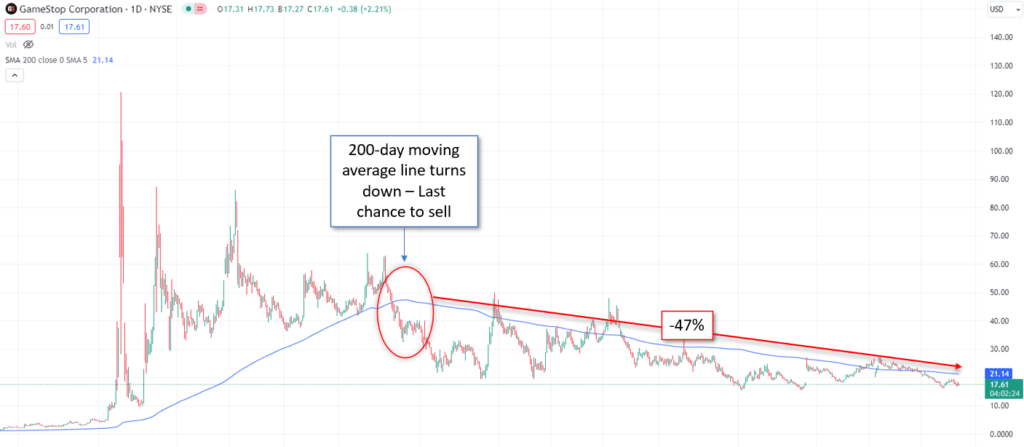
4. 200-day moving average line turns down. After a prolonged upswing, if a stock’s 200-day moving average price line turns down, consider selling the stock.
5. Living below the 10-week moving average. Consider selling if a stock has a long advance, then closes below its 10-week moving average and lives below that average for 8 or 9 consecutive weeks.
Other general selling strategies
1. If you cut all your losses at 7% or 8%, take a few profits when you’re up 20%, 25%, or 30%. Compounding three gains like this could give you an overall gain of 100% or more. However, don’t sell and take a 25% or 30% gain in any market leader with institutional support that’s run up 20% in only one, two, or three weeks from the pivot buy point on a proper base.Those could be your big leaders and should be held for a potentially greater profit.
3. In order to sell, big investors must have buyers to absorb their stock. Therefore, consider selling if a stock runs up and then good news or major publicity (a cover article in Business New York Time, for example) is released
4. Sell when there’s a great deal of excitement about a stock and it’s obvious to everyone that the stock is going higher. By then it’s too late. Jack Dreyfus said, “Sell when there is an overabundance of optimism. When everyone is bubbling over with optimism and running around trying to get everyone else to buy, they are fully invested. At this point, all they can do is talk. They can’t push the market up anymore. It takes buying power to do that.” Buy when you’re scared to death and others are unsure. Wait until you’re happy and tickled to death to sell
To conclude
Always learn from your previous selling errors. Create your own post-analysis by charting your previous buy and sell points. Examine your blunders carefully and make additional guidelines to avoid past mistakes that resulted in large losses or missed chances. This is how you become a wise investor.